In part 1, we examined M-Score and its ability to serve as a barometer for press sheet consistency. Read Part 1 Here.
Now, this is where it gets fun-the overall reason for writing this article. In these subcommittees, as part of the Print Properties Committee, ideas get explored, processes get created, test charts, workbooks, and beta datasets get proposed, and ideas are exchanged. So what's so cool about it? The PPC is open to any PRINTING United Alliance member. Meetings are held virtually once-a-month, and subcommittees regularly exchange data and ideas to further specific initiatives. Anyone interested in participating can join in on the varied and interesting discussions if they agree to the Code of Conduct for the Committee, not to exploit the information shared for personal or commercial purposes, but to consent to a free exchange of ideas and information to advance printing technologies for the benefit of the graphic arts community at large.
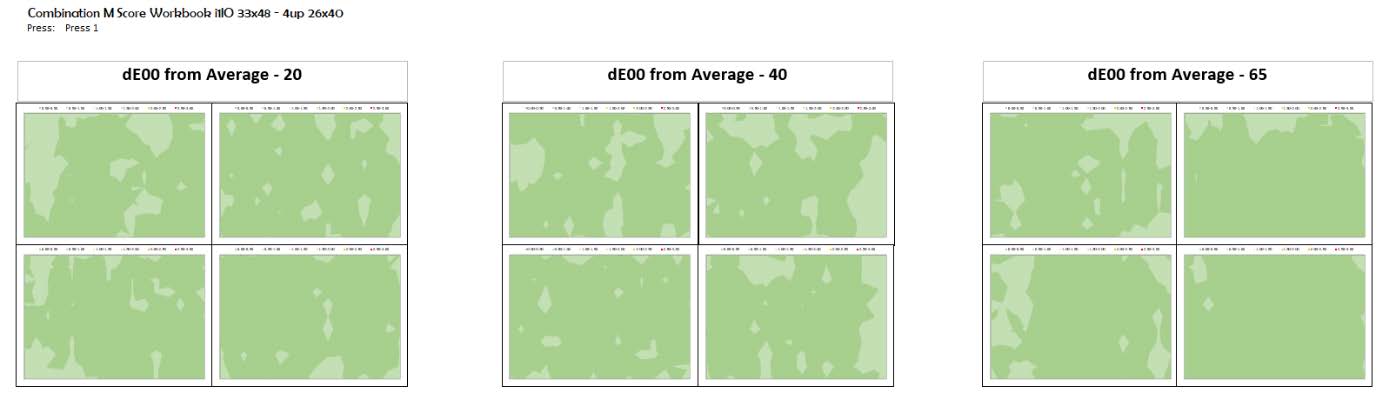
The PPC Subcommittee felt that analysis of the M Score data might yield some interesting and actionable information, so we began the task of expanding upon the simple pass/fail workbook to an Excel workbook, to both calculate the M Score using the new ISO formulas, and to look deeper into the data to see what could be found. In this advanced workbook (not part of the pre-qualification kit), we developed a series of Topocolormetric Maps, which showed the dE00, of each of the 2944 cells measured per sheet compared to the average for the sheet. These maps help to illustrate areas of the press sheet which deviate in color, and whether the deviations appear horizontally or vertically along the sheet.
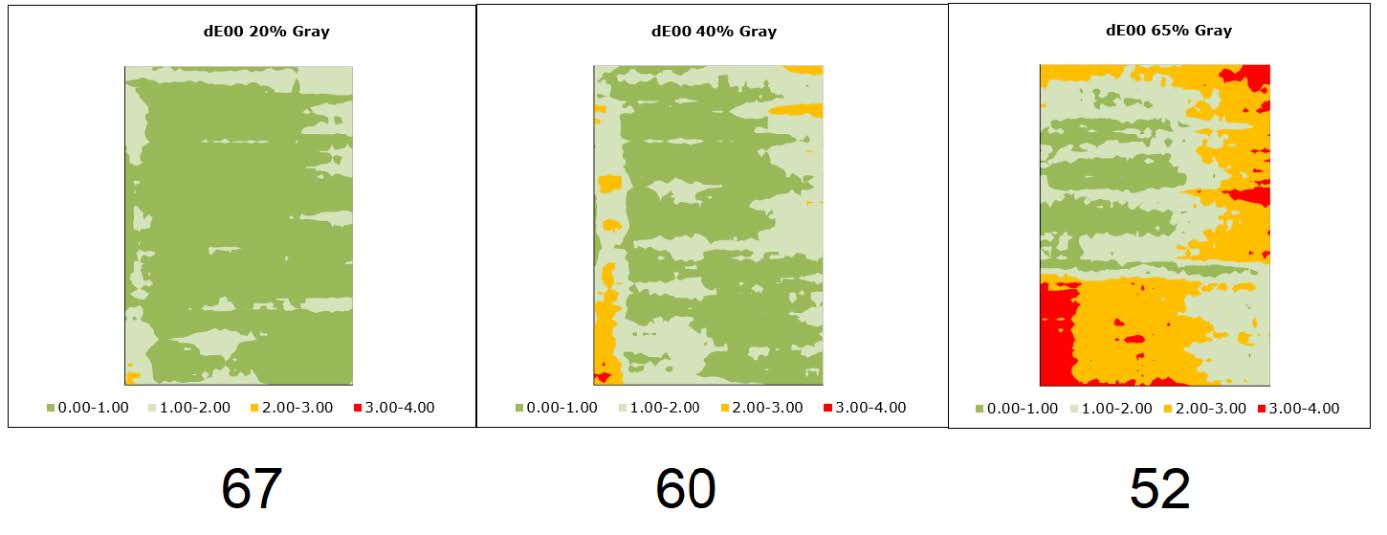
M Score results and Delta E00 Topocolormetric Maps showing deviations from the average of all 2944 points per 12 x 18 chart (3 Charts)
Some interesting patterns emerged, allowing an auditor to determine if a press was in good shape to profile and to be alerted of areas to avoid placement of charts and control strips. Only future analysis of a large data set with corresponding information on actual press conditions can help us analyze the results completely. Results could be used to help determine if press components, such as fuser rollers, static charging assemblies, or photo transfer drums/belts/blankets, might need to be cleaned or replaced prior to press profiling. Regular analysis of the patterns could lead to fewer service issues, giving operators insight into the proper problem resolution and avoiding replacement of viable parts and unnecessary service calls. Also, how do color management and GCR settings affect the results? Can improvement be gained by adjusting GCR Start and curve amounts? Profiling a press/paper combination is a common tactic in digital printing, and if you start with a press not in a repeatable, consistent condition, it can cause headaches later with mismatched or inconsistent colors.
Still, printing and measuring these three sheets on an iSisXL can be time consuming and expensive if the press is not active during the analysis phase. Color consultants and manufacturers technical resources often charge by the hour, and an hour spent waiting for these 3000 patch charts to measure is unproductive. This is where the above Objective #2 comes into play.
In an effort to minimize the time required and to maximize the instruments available for use, the subcommittee developed a third-generation workbook using a single 12x18 sheet matrix of the same 20, 40, and 65% CMYK patches, which can be read using the iSisXL, the KM FD9, or the xRite i1IO scanning spectrophotometers.
Using this 12x18 Combi Chart matrix and workbook, we were able to reduce the total patch count by over 80% from almost 9000 patches to just under 1600, and reduce the measurement time by a substantial margin.
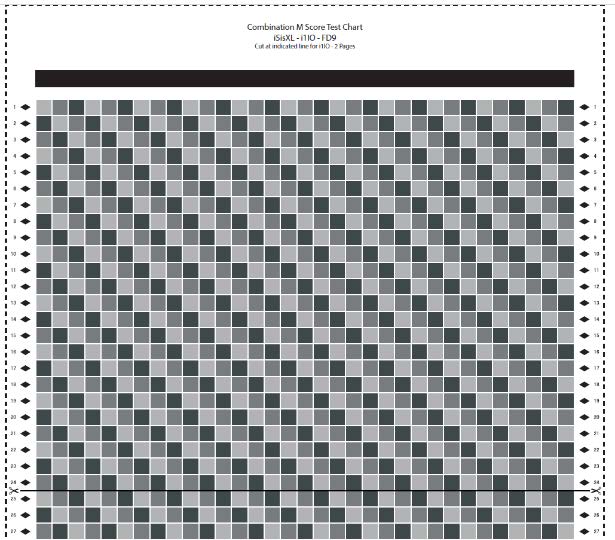
12x18 Combination M Score Test Chart - 33 columns x 48 rows - 1584 total patches - 528 patches per tonal value formatted for the iSisXL/FD9/i1IO Spectros.
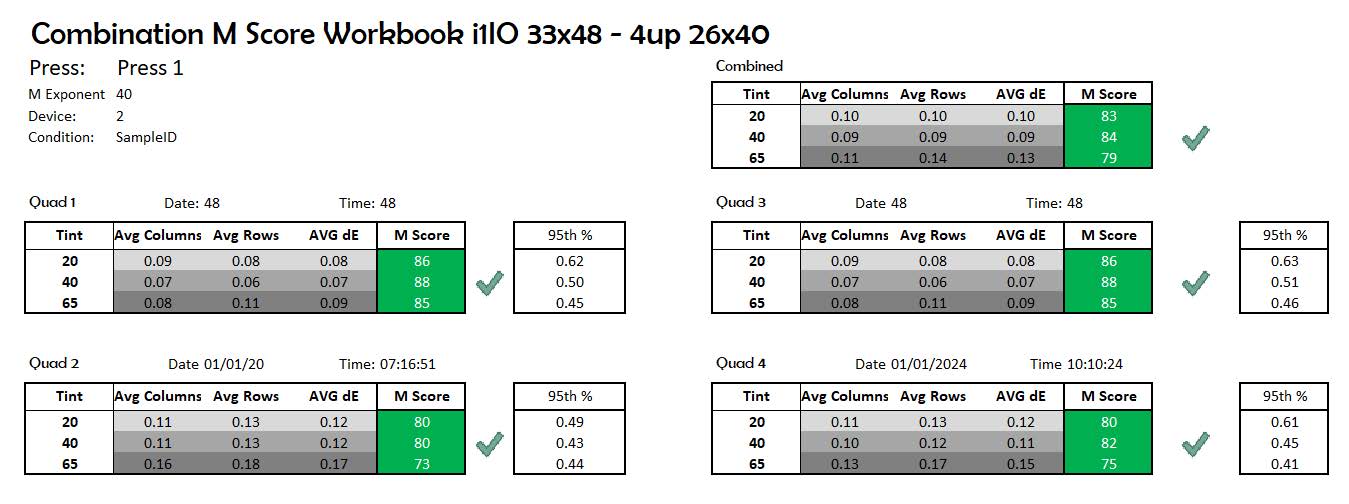
Comparing the results of the two methods showed that with a slight adjustment to the M Score math to account for fewer data points of the Combi chart, M Score results were very consistent with the original three sheet method and could be achieved in a fraction of the time. Conversely, the Topocolormetric maps showed results consistent with the larger 2944 data point charts when using the smaller 528 patch data set.
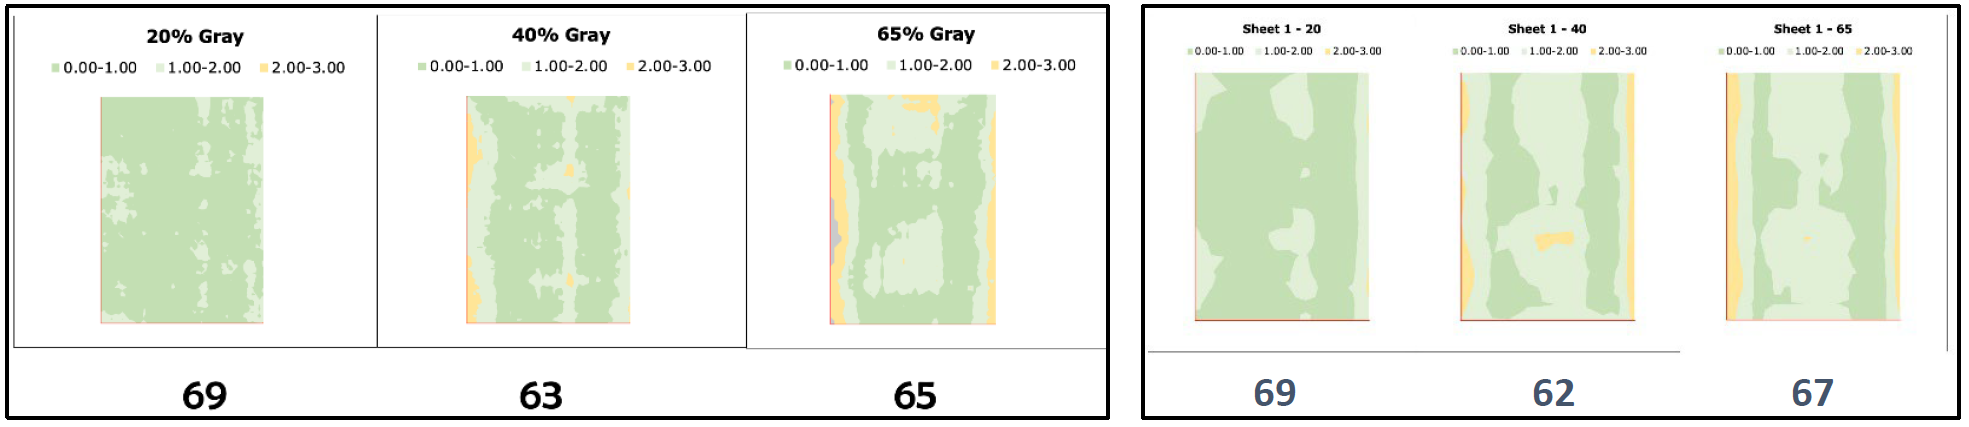
Left: Original 3 sheet Chart M Scores and ∆E00 Topocolormetric maps showing 2944 Data Points per sheet
Right: Single 12x18 Combi Topocolormetric maps with 528 Data Points per tone
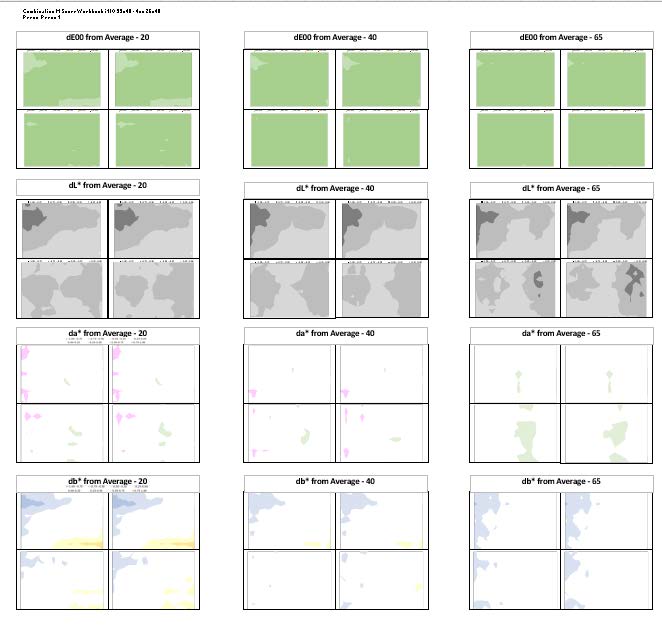
Continuing along the topocolormetric path, we developed dL*, da* and db* maps to show areas of higher and lower tonality and where the a* and b* chroma deviations were occurring.
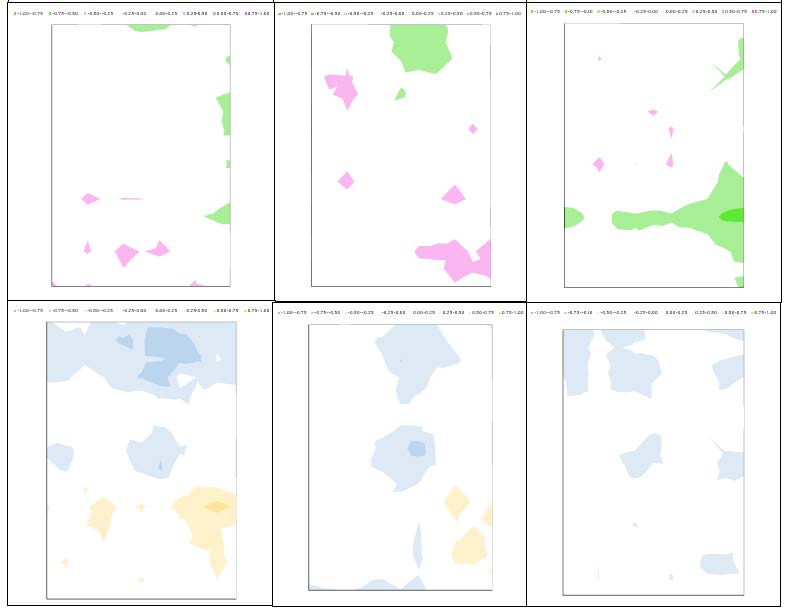
Topocolormetric Maps showing ∆E00 against the average or target, ∆*L for Tonality, ∆a* and ∆b* for chromatic
These maps can give further insight, allowing an operator to address specific printing components or ink/toner delivery systems to resolve a steaking or banding issue. That was all fine and dandy for a 12x18 sheet, but newer systems are now being offered in larger press sheet sizes. Can the M Score process be scaled to these larger press sheet sizes? Limitations of the measurement devices themselves dictate that larger sheets will have to be cut down to fit the sheet size limits of spectros. The iSisXL test charts have reference “footballs” on each side of the sheet, so a continuous measurement across or along the larger sheet sizes is impossible. The FD-9 also requires some margins left and right and each require some header/footer areas to feed the chart, so that leaves the lowly IO table as the only currently available option for automatically scanning a continuous large press sheet, which still must be sectioned to fit the platen.
Attempting to measure a continuous image may be a waste of resources. What if we simply repeat the same 12x18 sheet as a 2-up on half-sized and as a 4-up on 40 inch presses. Does the placement of these sheets accommodate the most usable/sellable areas of the press sheet? How does the scoring system scale? Would heap maps provide actionable information? These are some of the questions at hand.
We continued development of the workbook with this in mind. Currently the workbook can take measurements for up to 4 12x18 sheets and align the data and charts to display an average of M Scores and heatmaps for E00,
DL*, Da*, and Db* in 1up, 2up and 4 up sheet sizes.
Additionally, we have leveraged the data to produce “scatter” charts showing the plots for the a*b* axis along with the L*a* and L*b* axes.
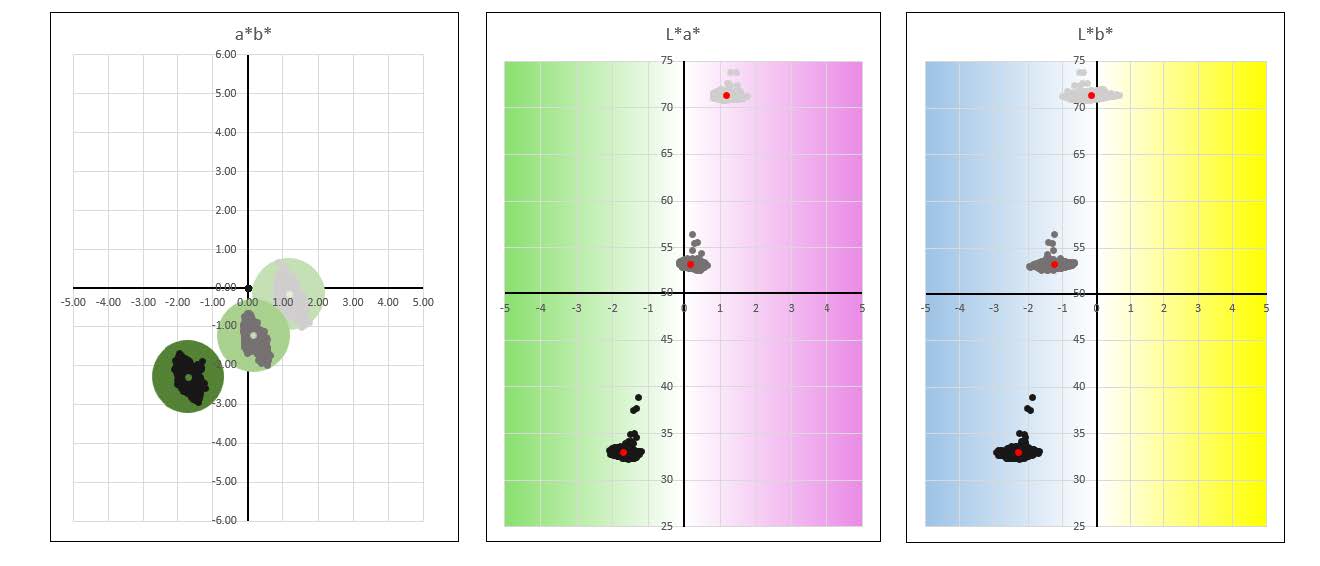
These Scatter Charts display all 4 quadrant sheets of a 4 up press sheet for plots of a*b*, L*a* and L*b* data points. The green circle in the a*b* scatter represents a ∆Ch of 1 from average. Data points above the L*a* and L*b* 20-40-65 “buckets” show outliers. Red dots represent the average of all data points in that “bucket”
These views can help identify outliers, the general distribution of the data points, and how the highlight, midtone and shadow areas relate to each other. Members of the subcommittee are attempting to consolidate these 3 views into a cohesive, statistically driven 3D view and to derive a more meaningful scoring system from the data beyond a simple pass/fail. A quantitative analysis might allow for a better scoring system, with quality control metrics ranging from “Proofing” to “Spot Color Matching” to “Pleasing Color” QC requirements.
This got me thinking about the message we are trying to convey with this test. M Score and all its derivatives are relatively unknown and mysterious to the general printing community. What metric, based on 3 gray patches, is most widely known? The simple answer was no further than my own company logo and common industry charts.
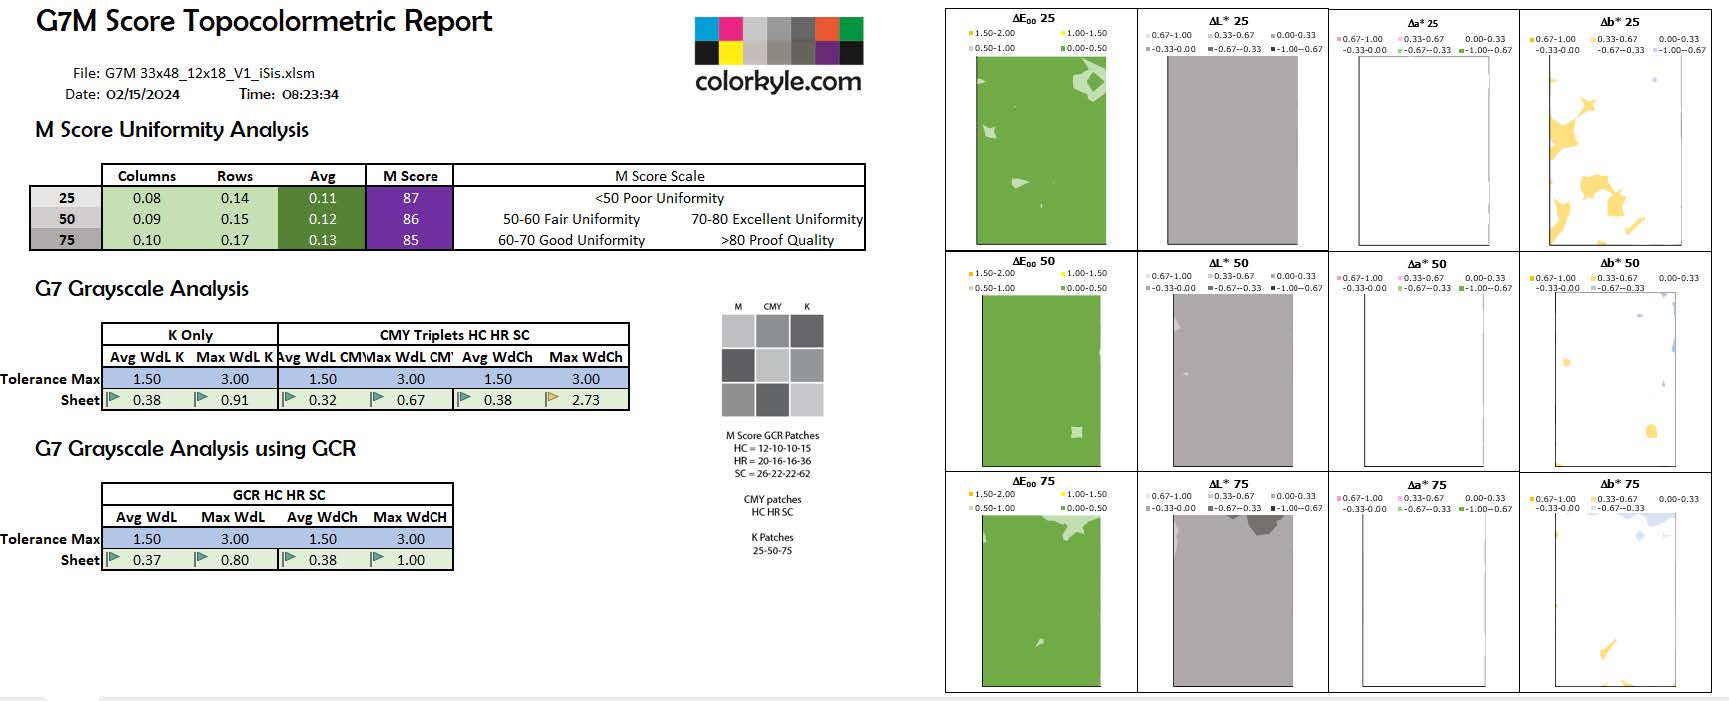
G7 Grayscale, the basis for G7. HC HR and SC patches along with their K equivalents compared to a target for Tonality and Grayscale Chroma.
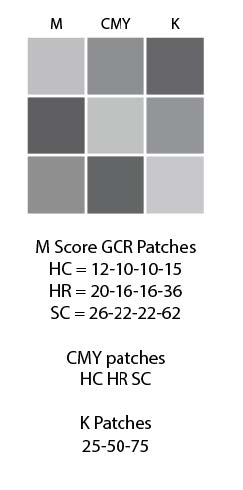
I altered the test form to use the HC HR HC patches along with the black tonality patches and compared using the G7 Grayscale metrics in addition to the M Score patches. This lets us add a target value for color management. I also altered the original M Score CMYK values to reflect a conversion of the HC-HR-SC patches to CMYK with GCR, which allowed me to compare those patches to the same target, validating or nullifying the press GCR strategy without affecting the M Score calculations. I used the Labs from the 2013 CRPC6 control strip reference, calculated WdL* and WdCh for each patch, then found the average and max for each column and row, then finally average and max those for the final result.
One column in three in the test form is used for MScore, GCR comparison and the Topocolormetric Maps from average, while the other two are the CMY and K columns for G7 Grayscale to a target colorspace.
Reporting Mscore through a scoring scale comprising of grayscale and tonality deviations from the target as well as GCR strategy results provides further opportunities for production optimization. Looking beyond M Score as a pass-fail for certification and considering G7 Grayscale over every square inch of the sheet is a message highly relatable to everyone in our industry.
If M Score and sheet uniformity are to move beyond a simple pass/fail for a press qualification to a more accepted commercial quality control metric, the process must be convenient, reliable and provide some reasonable, actionable data to be accepted by the printing community at large.
Feedback from end-users is an important factor in the development of such a process and Idealliance members can help by joining and participating in the PPC or by submitting samples of the test form measurements. Test forms and measurement references for the iSisXL, i1IO and FD9 spectros are available for public download and the current workbook is available to Print Properties Committee members for evaluation purposes. Public data submissions of test chart measurements will be accepted during an evaluation period and, using the current workbook, a PDF report will be delivered free of charge to any Idealliance member. Feedback from these reports will guide the committee on possible acceptance of the metrics and methodology.
Your participation and feedback can help the PPC continue to explore and this and a wide variety of other interesting printing related topics such as the UNC_UV profile, Observer Metamerism, LED lighting specs ECG profiles and the much sought after Universal Printing Condition profiles for a global agreement of print target specifications.